What is procfs
Procfs is a special virtual filesystem that can be mounted in your
directory tree, allowing processes in userspace to read kernel information
conveniently - using regular file I/O operations (like read(2) and write(2)).
The proc filesystem provides a method of communication between
kernel space and user space. For example, the GNU version of the process
reporting utility ps uses the proc file system to obtain its data, without
using any specialized system calls.
History Of Proc
Tom J. Killian implemented the UNIX 8th Edition (V8)
version of /proc: he presented a paper titled "Processes as Files" at
USENIX in June 1984. The design of procfs aimed to replace the ptrace
system call used for process tracing.
Ptrace
ptrace is a system call found in Unix and several Unix-like
operating systems. By using ptrace (the name is an abbreviation of "process
trace") one process can control another, enabling the controller to
inspect and manipulate the internal state of its target. ptrace is used by
debuggers and other code-analysis tools, mostly as aids to software
development.
Communications between the controller and target take place using
repeated calls of ptrace, passing a small fixed-size block of memory between
the two (necessitating two context switches per call); this is acutely
inefficient when accessing large amounts of the target's memory, as this can
only be done in word sized blocks (with a ptrace call for each word).For this
reason the 8th edition of Unix introduced procfs, which allows permitted
processes direct access to the memory of another process - 4.4BSD followed, and
the use of /proc for debugger support was inherited by Solaris, BSD, and AIX,
and mostly copied by Linux. Some, such as Solaris, have removed ptrace as a
system call altogether, retaining it as a library call that reinterprets calls
to ptrace in terms of the platform's procfs
Mount /proc
Typically, it is mounted automatically by the system, but it can
also be mounted manually using a command such as:
# mount -t proc proc /proc

Viewing Virtual Files
Most virtual files within /proc can be viewed by using commands
such as cat, more, and less. For example, to view information about the system’s
CPU, enter:

Certain files can only be accessed with root privileges. Some
files in /proc contain
information that is not human readable. Use utilities such as
lspci, free, and top to view
Changing Virtual Files
Most virtual files within the /proc directory are read-only.
However, some are writable and
can be used to adjust settings in the kernel. This is especially
true for files in the /proc/sys
directory. To change the value of a virtual file, use the
following syntax:
# echo value > /proc/file
For example, to change the host name, enter:
# echo www.example.com > /proc/sys/kernel/hostname

Top-Level Files Within /proc
Some of the more useful virtual files in the top-level of the
/proc directory are described here. This is not meant to be an all-inclusive
list, but to give examples of some of the files and their purpose. Many of
these files are described further in applicable lessons.
· /proc/buddyinfo: This file is used
primarily for diagnosing memory fragmentation issues.
This file contains information which is used for
diagnosing memory fragmentation issues.
Each line starts with the identification of the node and the name of the
zone which together identify a memory
region This is then followed by the count of available chunks of a certain
order in which these zones are split.
The size in bytes of a certain order is given by theformula:
(2^order) * PAGE_SIZE

· /proc/cmdline: This file shows the parameters
passed to the kernel at the time it is started.
· /proc/cpuinfo: This virtual file identifies the
type of processor used by your system.

This is a collection of CPU and system architecture
dependent items, for each supported architecture a different list. Two common
entries are processor which gives CPU number and bogomips; a system constant
that is calculated during kernel initialization. SMP machines have information
for each CPU.
The lscpu(1) command gathers its information from this file.
- processor – Provides each processor with an identifying number. If you have one processor it will display a 0. If you have more than one processor it will display all processor information separately counting the processors using zero notation.
- cpu family – Authoritatively tells you the type of processor you have in the system. If your computer is an Intel-based system, simply place the number in front of “86” to determine the value. This is helpful to determine the type of architecture of an older system and is helpful in determining which compiled RPM package would best suit that system.
- model name – Gives you the common name of the processor, including the project name.
- cpu MHz – Shows the processor’s precise speed, in megahertz, to the thousandth decimal point.
- cache size – Tells you the amount of level 2 memory cache available to the processor.
- flags – Defines a number of different processor attributes, such as the presence of a floating-point unit (FPU) and the ability to process MMX instructions.
· /proc/crypto: This file lists all installed
cryptographic ciphers used by the Linux kernel, including additional details
for each.

· /proc/devices: This file displays the various
character and block devices currently configured (not including devices whose
modules are not loaded).

The output from /proc/devices includes the major
number and name of the device, and is broken into two major sections: Character
devices and Block devices.
Character devices are similar to block devices, except
for two basic differences:
Character devices do not require buffering. Block
devices have a buffer available, allowing them to order requests before
addressing them. This is important for devices designed to store information —
such as hard drives — because the ability to order the information before
writing it to the device allows it to be placed in a more efficient order.
Character devices send data with no preconfigured
size. Block devices can send and receive information in blocks of a size
configured per device.
· /proc/execdomains: This file lists the
execution domains currently supported by the Linux kernel, along with the range
of personalities they support.

/proc/filesystems: This file displays a
list of the file system types currently supported by the kernel. The first
column signifies whether the file system is mounted on a block device. Those
beginning with nodev are not mounted on a device. The second column lists the
names of the file systems supported. The mount command cycles through the file
systems listed here when one is not specified as an argument.

The first column signifies whether the file system is
mounted on a block device. Those beginning with nodev are not mounted on a
device. The second column lists the names of the file systems supported.
The mount command cycles through the file systems
listed here when one is not specified as an argument
· /proc/interrupts: This file records
the number of interrupts per IRQ on the x86 architecture.

The first column refers to the IRQ number. Each CPU in
the system has its own column and its own number of interrupts per IRQ. The
next column reports the type of interrupt, and the last column contains the
name of the device that is located at that IRQ.
· /proc/iomem: This file shows you the current
map of the system’s memory for each physical device.

The first column displays the memory registers used by
each of the different types of memory. The second column lists the kind of
memory located within those registers and displays which memory registers are
used by the kernel within the system RAM or, if the network interface card has
multiple Ethernet ports, the memory registers assigned for each port.
· /proc/ioports: This file provides a list of
currently registered port regions used for input or output communication with a
device.

The first column gives the I/O port address range
reserved for the device listed in the second column.
· /proc/kcore: This file represents the
physical memory of the system and is stored in the core file format. The
contents of this file are designed to be examined by a debugger, such as gdb,
and is not human readable.

· /proc/loadavg: This file provides a look at the
load average in regard to both the CPU and I/O over time, as well as additional
data used by uptime and other commands.

The first three columns measure CPU and IO utilization
of the last one, five, and 15 minute periods. The fourth column shows the
number of currently running processes and the total number of processes. The
last column displays the last process ID used.
In addition, load average also refers to the number of
processes ready to run (i.e. in the run queue, waiting for a CPU share.
· /proc/locks: This file displays the files
currently locked by the kernel. The contents of this file contain internal
kernel debugging data and can vary tremendously, depending on the use of the
system.

Each lock has its own line which starts with a unique
number. The second column refers to the class of lock used, with FLOCK
signifying the older-style UNIX file locks from a flock system call and POSIX
representing the newer POSIX locks from the lockf system call.
The third column can have two values: ADVISORY or
MANDATORY. ADVISORY means that the lock does not prevent other people from
accessing the data; it only prevents other attempts to lock it. MANDATORY means
that no other access to the data is permitted while the lock is held. The
fourth column reveals whether the lock is allowing the holder READ or WRITE
access to the file. The fifth column shows the ID of the process holding the
lock. The sixth column shows the ID of the file being locked, in the format of
MAJOR-DEVICE:MINOR-DEVICE:INODE-NUMBER. The seventh and eighth column shows the
start and end of the file's locked region.
· /proc/mdstat: This file contains the current
information for multiple-disk, RAID configurations.

This file remains in the same state as seen above
unless a software RAID or md device is present. In that case, view /proc/mdstat
to find the current status of mdX RAID devices.
· /proc/meminfo: This file reports a large amount
of valuable information about the system’s RAM usage.

While the file shows kilobytes (kB; 1 kB equals 1000
B), it is actually kibibytes (KiB; 1 KiB equals 1024 B). This imprecision in
/proc/meminfo is known, but is not corrected due to legacy concerns - programs
rely on /proc/meminfo to specify size with the "kB" string.
Much of the information in /proc/meminfo is used by
the free, top, and ps commands. In fact, the output of the free command is
similar in appearance to the contents and structure of /proc/meminfo. However,
/proc/meminfo itself has more details:
- MemTotal — Total amount of usable RAM, in kibibytes, which is physical RAM minus a number of reserved bits and the kernel binary code.
- MemFree — The amount of physical RAM, in kibibytes, left unused by the system.
- Buffers — The amount, in kibibytes, of temporary storage for raw disk blocks.
- Cached — The amount of physical RAM, in kibibytes, used as cache memory.
- SwapCached — The amount of memory, in kibibytes, that has once been moved into swap, then back into the main memory, but still also remains in the swapfile. This saves I/O, because the memory does not need to be moved into swap again.
- Active — The amount of memory, in kibibytes, that has been used more recently and is usually not reclaimed unless absolutely necessary.
- Inactive — The amount of memory, in kibibytes, that has been used less recently and is more eligible to be reclaimed for other purposes.
- Active(anon) — The amount of anonymous and tmpfs/shmem memory, in kibibytes, that is in active use, or was in active use since the last time the system moved something to swap.
- Inactive(anon) — The amount of anonymous and tmpfs/shmem memory, in kibibytes, that is a candidate for eviction.
- Active(file) — The amount of file cache memory, in kibibytes, that is in active use, or was in active use since the last time the system reclaimed memory.
- Inactive(file) — The amount of file cache memory, in kibibytes, that is newly loaded from the disk, or is a candidate for reclaiming.
- Unevictable — The amount of memory, in kibibytes, discovered by the pageout code, that is not evictable because it is locked into memory by user programs.
- Mlocked — The total amount of memory, in kibibytes, that is not evictable because it is locked into memory by user programs.
- SwapTotal — The total amount of swap available, in kibibytes.
- SwapFree — The total amount of swap free, in kibibytes.
- Dirty — The total amount of memory, in kibibytes, waiting to be written back to the disk.
- Writeback — The total amount of memory, in kibibytes, actively being written back to the disk.
- AnonPages — The total amount of memory, in kibibytes, used by pages that are not backed by files and are mapped into userspace page tables.
- Mapped — The memory, in kibibytes, used for files that have been mmaped, such as libraries.
- Shmem — The total amount of memory, in kibibytes, used by shared memory (shmem) and tmpfs.
- Slab — The total amount of memory, in kibibytes, used by the kernel to cache data structures for its own use.
- SReclaimable — The part of Slab that can be reclaimed, such as caches.
- SUnreclaim — The part of Slab that cannot be reclaimed even when lacking memory.
- KernelStack — The amount of memory, in kibibytes, used by the kernel stack allocations done for each task in the system.
- PageTables — The total amount of memory, in kibibytes, dedicated to the lowest page table level.
- NFS_Unstable — The amount, in kibibytes, of NFS pages sent to the server but not yet committed to the stable storage.
- Bounce — The amount of memory, in kibibytes, used for the block device "bounce buffers".
- WritebackTmp — The amount of memory, in kibibytes, used by FUSE for temporary writeback buffers.
- CommitLimit — The total amount of memory currently available to be allocated on the system based on the overcommit ratio (vm.overcommit_ratio). This limit is only adhered to if strict overcommit accounting is enabled (mode 2 in vm.overcommit_memory For example, on a system with 1 GB of physical RAM and 7 GB of swap with a vm.overcommit_ratio of 30 it would yield a CommitLimit of 7.3 GB.
- Committed_AS — The total amount of memory, in kibibytes, estimated to complete the workload. This value represents the worst case scenario value, and also includes swap memory.
- VMallocTotal — The total amount of memory, in kibibytes, of total allocated virtual address space.
- VMallocUsed — The total amount of memory, in kibibytes, of used virtual address space.
- VMallocChunk — The largest contiguous block of memory, in kibibytes, of available virtual address space.
- HardwareCorrupted — The amount of memory, in kibibytes, with physical memory corruption problems, identified by the hardware and set aside by the kernel so it does not get used.
- AnonHugePages — The total amount of memory, in kibibytes, used by huge pages that are not backed by files and are mapped into userspace page tables.
- HugePages_Total — The total number of hugepages for the system. The number is derived by dividing Hugepagesize by the megabytes set aside for hugepages specified in /proc/sys/vm/hugetlb_pool. This statistic only appears on the x86, Itanium, and AMD64 architectures.
- HugePages_Free — The total number of hugepages available for the system. This statistic only appears on the x86, Itanium, and AMD64 architectures.
- HugePages_Rsvd — The number of unused huge pages reserved for hugetlbfs.
- HugePages_Surp — The number of surplus huge pages.
- Hugepagesize — The size for each hugepages unit in kibibytes. By default, the value is 4096 KB on uniprocessor kernels for 32 bit architectures. For SMP, hugemem kernels, and AMD64, the default is 2048 KB. For Itanium architectures, the default is 262144 KB. This statistic only appears on the x86, Itanium, and AMD64 architectures.
- DirectMap4k — The amount of memory, in kibibytes, mapped into kernel address space with 4 kB page mappings.
- DirectMap2M — The amount of memory, in kibibytes, mapped into kernel address space with 2 MB page mappings.
· /proc/modules: This file displays a list of all
modules loaded into the kernel. Most of this information can also be viewed by
using the /sbin/lsmod command.

The first
column contains the name of the module.
The second
column refers to the memory size of the module, in bytes.
The third
column lists how many instances of the module are currently loaded. A value of
zero represents an unloaded module.
The fourth
column states if the module depends upon another module to be present in order
to function, and lists those other modules.
The fifth
column lists what load state the module is in: Live, Loading, or Unloading are
the only possible values.
The sixth
column lists the current kernel memory offset for the loaded module. This
information can be useful for debugging purposes, or for profiling tools such
as oprofile.
Process Directories in /proc
The /proc directory contains directories with numerical names.
These directories are named after a program’s process ID and contain
information about that process. The owner and group of each process directory
are set to the user running the process. Each process directory contains
several files including:

· cmdline: The command issued when starting the process
· cwd: A symbolic link to the current working directory for
the process
· environ: A list of the environment variables for the process
· exe: A symbolic link to the executable of this process
· fd: The directory containing all of the file descriptors
for a particular process
· maps: A list of memory maps to executables and library files
associated with process
· mem: The memory held by the process (the file cannot be
read by the user)
· root: A link to the root directory of the process
· stat: The status of the process including run state and
memory usage
· statm: The status of the memory in use by the process
· status: The status of the process in a more readable form
than stat or statm
Other Directories in /proc
Other directories within the/proc directory group similar
information by topic. The following is a partial list of these directories:
· /proc/bus: This directory contains
information about the various buses available on the system. The subdirectories
and files available within /proc/bus vary depending on the devices connected to
the system.

· /proc/bus/pci, /proc/bus/usb:
You can get a list of all PCI and USB devices present on the system by using
the cat command on the devices file within these directories, but the output is
difficult to read and interpret. For a human-readable list of devices, run the
lspci and lsusb commands.
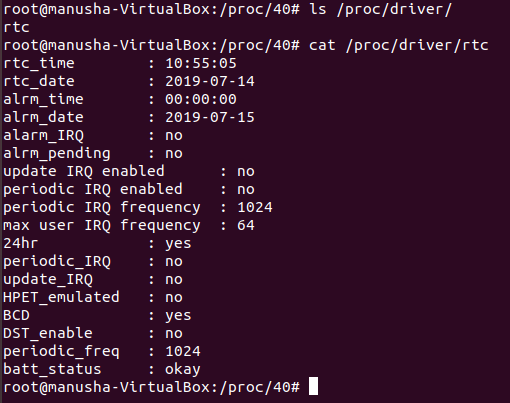
· /proc/driver: This directory contains
information for specific drivers in use by the kernel.
· /proc/fs: This directory shows which file systems are
exported. If running an NFS server, typing cat /proc/fs/nfsd/exports displays
the file systems being shared and the permissions.

· /proc/self/net: This directory provides a
comprehensive look at various networking parameters and statistics. Each
directory and virtual file within this directory describes aspects of the
system’s network configuration. The /proc/net file is a symbolic link to this
directory.

- arp — Lists the kernel's ARP table. This file is particularly useful for connecting a hardware address to an IP address on a system.
- atm/ directory — The files within this directory contain Asynchronous Transfer Mode (ATM) settings and statistics. This directory is primarily used with ATM networking and ADSL cards.
- dev — Lists the various network devices configured on the system, complete with transmit and receive statistics. This file displays the number of bytes each interface has sent and received, the number of packets inbound and outbound, the number of errors seen, the number of packets dropped, and more.
- dev_mcast — Lists Layer2 multicast groups on which each device is listening.
- igmp — Lists the IP multicast addresses which this system joined.
- ip_conntrack — Lists tracked network connections for machines that are forwarding IP connections.
- ip_tables_names — Lists the types of iptables in use. This file is only present if iptables is active on the system and contains one or more of the following values: filter, mangle, or nat.
- ip_mr_cache — Lists the multicast routing cache.
- ip_mr_vif — Lists multicast virtual interfaces.
- netstat — Contains a broad yet detailed collection of networking statistics, including TCP timeouts, SYN cookies sent and received, and much more.
- psched — Lists global packet scheduler parameters.
- raw — Lists raw device statistics.
- route — Lists the kernel's routing table.
- rt_cache — Contains the current routing cache.
- snmp — List of Simple Network Management Protocol (SNMP) data for various networking protocols in use.
- sockstat — Provides socket statistics.
- tcp — Contains detailed TCP socket information.
- tr_rif — Lists the token ring RIF routing table.
- udp — Contains detailed UDP socket information.
- unix — Lists UNIX domain sockets currently in use.
- wireless — Lists wireless interface data.
· /proc/scsi: The primary file in this
directory is /proc/scsi/scsi, which contains a list of every recognized SCSI
device. From this listing, the type of device, as well as the model name,
vendor, SCSI channel, and ID data is available.

· /proc/sys: This directory is different from
others in /proc, because it not only provides information about the system but
also allows you to immediately enable and disable kernel features. If a file
has write permissions, it can be used to configure the kernel. Changing a value
within a /proc/sys/ file is done by echoing the new value into the file. For
example, to change the host name to www.example.com:

- /proc/sys/dev:
This directory provides parameters for particular devices on the system.

- /proc/sys/fs:
This directory contains options and information concerning various aspects
of the file system, including quota, file handle, and inode information.

- /proc/sys/kernel:
This directory contains a variety of different configuration files that
directly affect the operation of the kernel.

- /proc/sys/net:
This directory contains subdirectories concerning various networking
topics. You can alter the files within these directories to adjust the
network configuration on a running system.

- /proc/tty:
This directory contains information about the available and currently used
tty devices on the system. The drivers file is a list of the current tty
devices in use.

Reference
APPENDIX E. THE PROC FILE SYSTEM : https://access.redhat.com/documentation/en-us/red_hat_enterprise_linux/6/html/deployment_guide/ch-proc
Some consultants keep that it advanced from the Macao board sport within the 19th century. Other historians imagine that its origins 우리카지노 date back to 15th century Italy and that it was popularized by Charles VIII’s soldiers during the Franco-Italian struggle. As find a way to|you possibly can} see, a single phrase of fantastic print can have an enormous impression on the value of a welcome provide.
ReplyDeleteGreat blog postt
ReplyDelete